There are many views and reports available to track project progress. A number of these views are based on data found in a key Geniusproject document titled, "Project Overview".
Project Overviews are setup to be generated automatically, however they can also be generated or updated manually, directly from the project description document or from the overviews view.
To learn how to generate a Project Overview from the Project Description document, see the chapter titled "Create Project – Project definition / Create Project Overview".
To manage project overviews from the view:

All existing overviews will appear in the content window categorized by project name.
To update an existing report, locate the desired project and period, and open the report in edit mode.
By clicking on one of the indicators in the view, the project overview opens. Many indicators and indexes are available for budget, workload as well as earned value analysis. Please refer to the help file to learn more about "Project overviews".
Many of the Project Tracking views are based on the "Project overviews".
The Overviews group data together on a monthly basis; the following documents are used to generate a project overview:
Graphical displays of data are a nice way to get a quick glance at a project's status. A series of charts are available for each of the different views. Select a document in the view; the details of the selected document will be the parameters for the chart.
Clicking on the "chart" icon in the menu bar and a pop-up window with a list of predefined charts will open. Select the one you would like to display.

All charts are predefined in the application setup. You can define and configure your own charts, as well as customize the existing ones.
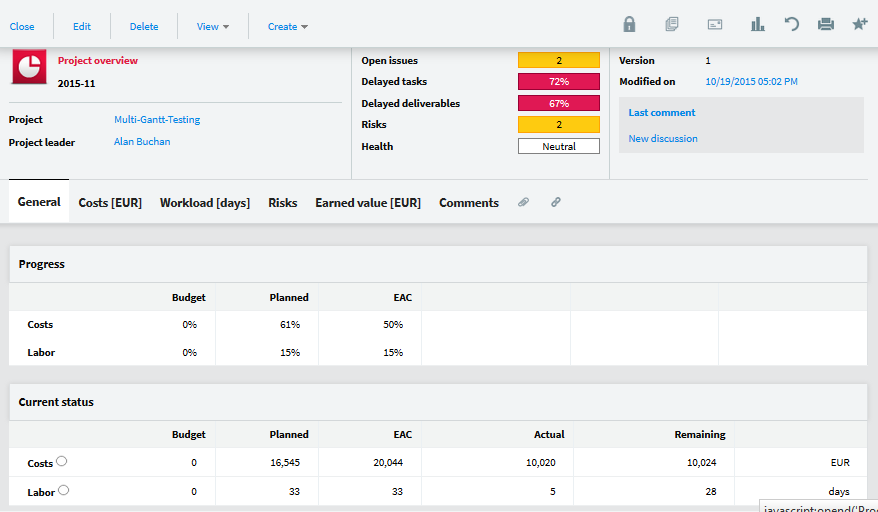
The Project Overview Header
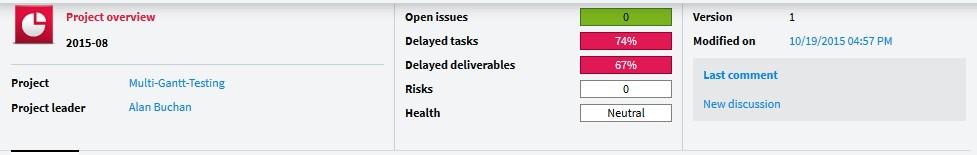
Project Name | The project title, in the example above – "SaaS Version". |
Project leader | Name of the project leader. By default will always be the creator of the new project. |
Open Issues | Displays the number of Issue report documents that are still open. Green: Good. By default, no reported issues remain open, i.e. the 'Issue reports' all have a status of ‘completed.’ Yellow: Medium. By default, at most three issues remain open. Red: Bad. More than three issues are still open, i.e. the 'Issue report' documents are still in an open status. The default thresholds can be changed in the 'General' setup document. |
Delayed tasks | Displays the percentage of delayed tasks in the project. Green: Good. By default, less than 10% of delayed tasks. Yellow: Medium. By default, less than 20% of delayed tasks. Red: Bad. By default, more than 20% of delayed tasks. The default thresholds can be changed in the 'General' setup document. |
Delayed deliverables | Displays the percentage of delayed deliverables in the project. Green: Good. By default, less than 10% of delayed deliverables. |
| Yellow: Medium. By default, less than 20% of delayed deliverables. Red: Bad. By default, more than 20% of delayed deliverables. The default thresholds can be changed in the 'General' setup document. |
Risks | Displays the number of risks defined for the project. If there are no Risk documents for the project then it is indicated with the icon and the number 0 is displayed. The icon displayed to the left of the severity depends on the place of the risks in the matrix: White: No risk defined. Green: All defined risks are in the green part of the matrix. Yellow: All defined risks are at most in the orange part of the matrix. Red: There is at least one risk in the red part of the matrix. |
Health | This value is defined manually by the project leader in the project description document. |
The "General" tab
Progress | Various indicators showing the project progress. Costs - Budget %: Actual cost (from the Tasks and Costs records) divided by the budgeted costs. Costs - Planned %: Actual cost divided by the planned cost (from the 'Task' and 'Cost' documents). Costs - EAC %: Actual cost divided by the total cost estimated at completion. Labor - Budget %: Actual work (i.e. the time spent since the beginning of the project) divided by the budgeted workload. Labor - Planned %: Actual work divided by the planned workload (from the 'Task' documents). Workload - Economic %: 100% - (the remaining work divided by the planned work). Labor- EAC %: Actual work divided by the total work estimated at completion. For example, if the budgeted workload is 15 days, the planned work is 16 days, the actual work is 10 days, the remaining work is 8 days, and so the re-estimated work is 18 days: Labor - Budget %: 66.6% Labor - Planned %: 62.5% Labor - EAC %: 55.5% |
Current Status | The cost value comes from the Budget section of the Project description, the 'Tasks' records and the 'Cost' documents. The currency is the reference currency as defined in the General setup document. Green: Good. By default, the actual costs are still within the budget. Yellow: Medium. By default, the actual costs are over budget but not by more than 120% of the budget. Red: Bad. By default, the actual costs are over budget by more than 120%. The default thresholds can be changed in the 'General' setup document. The Labor values come from the 'Task' and 'Timesheet details' records. The unit is the workload unit as defined in the 'General' setup document, i.e. hours or days |
| Green: Good. By default, the actual workload is still within budget. Yellow: Medium. By default, the actual workload is over budget but not by more than 120% of the budget. Red: Bad. By default, the actual workload is over budget by more than 120%. The default thresholds can be changed in the 'General' setup document. |
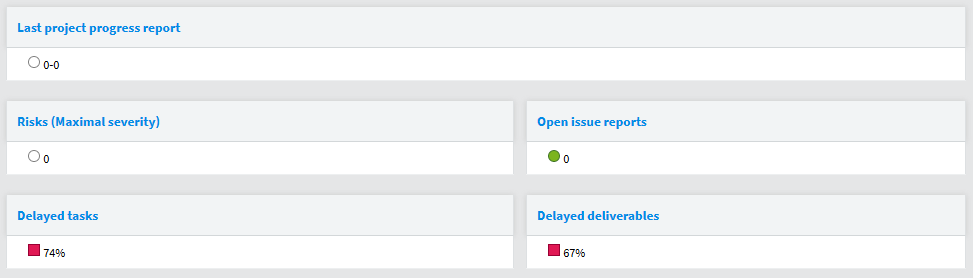
Last project progress report | Displays the date of the last progress report; if a project’s Progress report document does not yet exist for the calculated period or for previous periods, then the period 0-0 is displayed. The following indicators are related to the ‘Unsolved problems' and the 'Solved problems' fields in the 'Progress report' document. Green: Good. This icon is displayed if no problems have been found. i.e. If the 'Found problems' field is set to 'No' in the last 'Progress report' document. Yellow: Medium. This icon indicates that problems are resolved. i.e. If the 'Found problems' and 'Solved problems' fields are both set to "Yes" in the last 'Progress report' document. Red: Bad. One or several problems are described without any solution. i.e. The 'Found problems' is set to "Yes" and the 'Solved problems' field is set to 'No' in the last 'Progress report' document. |
Risks (Maximal severity) | Displays the maximal severity among the risks defined for the project. If no Risk document is available for the project then it is indicated with the icon and the number 0 is displayed. The icon displayed to the left of the severity depends on the place of the risks in the matrix: White: No risk defined. Green: All defined risks are in the green part of the matrix. Yellow: All defined risks are at the most in the orange part of the matrix. Red: There is at least one risk in the red part of the matrix. |
Open issue reports | Displays the number of Issue report documents that are still open. Green: Good. By default, no reported issues remain open, i.e. the 'Issue report' all have a completed status. Yellow: Medium. By default, at most three issues remain open. Red: Bad. More than three open issues remaining. i.e. the 'Issue report' documents still have a status of ‘open’. The default thresholds can be changed in the 'General' setup document. |
Delayed tasks | Displays the percentage of delayed tasks in the project. Green: Good. By default, less than 10% of delayed tasks. Yellow: Medium. By default, less than 20% of delayed tasks. |
| Red: Bad. By default, more than 20% of delayed tasks. The default thresholds can be changed in the 'General' setup document. |
Delayed deliverables | Displays the percentage of delayed deliverables in the project. Green: Good. By default, less than 10% of delayed deliverables. Yellow: Medium. By default, less than 20% of delayed deliverables. Red: Bad. By default, more than 20% of delayed deliverables. The default thresholds can be changed in the 'General' setup document. |
"Costs" tab

Note: The currency is the reference currency as defined in the General setup document.
All of the calculations for the 'Period' columns are either done according to the timesheet lines (if any exist on the project), or in a differential way (in comparison to the previous period).
The calculation from the timesheet lines is always correct, whatever the calculation date of the overview, as the timesheet lines are identified by period (provided that all Timesheets records were filled in by the time they were due).
The differential way implies a calculation of overviews each day to ensure that the information is up- to-date (this can be done through the corresponding scheduled agent, as set by the administrator).
|
| Values coming from the 'Budget' section of the Project description |
Expense s | Budget | document. Labor: The value is the sum of the budgeted costs arising from activities |
|
| performed by team members. |
|
| Inv & Exp: The value is the sum of the non-labor related budgeted costs (Investments and Expenses). Total: The total budgeted costs. |
Planned | Values coming from the Task and Cost records Labor: The value is the sum of the costs of planned labor for tasks Inv & Exp: The value is the sum of all non-labor related planned costs (Investments and Expenses). Total: The total planned costs. |
EAC | Estimated At Completion. Values coming from the 'Timesheet detail,' 'Task,' 'Assignments' and 'Cost' records. Labor: Sum of the actual (total) costs and remaining costs for labor. Inv & Exp: Sum of the actual (total) costs and remaining costs for Investments & expenses. Total: The total cost estimated at completion. |
Actual (Period) | Values coming from the ‘Timesheet detail,’ ‘Task,’ ‘Assignments’ and ‘Cost’ documents. Labor: The cost of labor during the period. See warning above for calculation. Inv & Exp: Sum of the 'Actual amount' fields of all 'Cost' records that have an 'Actual date' within the period. Total: The actual total costs for the period. |
Actual | Values coming from the 'Timesheet detail', 'Task', 'Assignments' and 'Cost' records. Labor: The actual cost of work performed as of the calculation date. Inv & Exp: Sum of the 'Actual amount' fields of all 'Cost' documents where the value of the 'Actual date' date field is in or before the period. Total: The total actual costs. |
Remainin g | Values coming from the 'Assignments' and 'Cost' records. Labor: The total remaining cost of all 'Assignments.' Inv & Exp: The total planned cost of all 'Cost' documents that do not have an actual end date, or have an actual end date which is after the period. Total: The total remaining costs. |
Billing |
Budget | Values coming from the project 'Budget.' Labor: The value is the sum of the budgeted billable amounts for labor. Inv & Exp: The value is the sum of billable non-labor related costs budgeted for Investments and Expenses. Total: The total budgeted billable amount. |
Planned | Values coming from the Tasks and Costs records Labor: The value is the sum of planned billable costs for labor on tasks. Inv & Exp: The value is the sum of the costs for planned billable Investments and Expenses. Total: The total planned billing amount. |
Actual (Period) |
Values coming from the Timesheet detail, Task, Assignments and Cost records. Labor: The billable labor performed during the period. See warning above for calculation. |
|
| Inv & Exp: Sum of the 'Actual billing amount' fields of all 'Cost' records that have an 'Actual date' date field which contains a date that is in the period. Total: The actual total billing amount for the period. |
Actual | Values coming from the 'Timesheet detail', 'Task', 'Assignments' and 'Cost' records. Labor: Total of billable labor at the time of the overview document calculation Inv & Exp: Sum of the 'Actual billing’ fields of all 'Cost' records that have an 'Actual date' date field which contains a date that is in or before the period. Total: The total billing costs. |
Remainin g | Values coming from the 'Assignments' and 'Cost' records. Labor: The total cost of remaining billable 'Assignments.' Inv & Exp: The total billable amount of all 'Cost's which do not have an actual end date, or having an actual end date which is after the period. Total: The total remaining billing. |
Margins |
Budget | Values coming from the 'Budget' of the Project Labor: The value is the sum of the budgeted margin for activities performed by team members. Inv & Exp: The value is the sum of the budgeted margin for Investments and Expenses. Total: The total budgeted margin. |
Planned | Values coming from the Tasks and Costs records Labor: The value is the sum of the planned margin on tasks. Inv & Exp: The value is the sum of planned margin on Investments and Expenses. Total: The total planned margin. |
Actual (Period) | Values coming from the Timesheet detail, Task, Assignments and Cost records. Labor: The margin on labor performed during the period. See warning above for calculation. Inv & Exp: Sum of the 'Actual margin fields of all 'Cost' records that have an 'Actual date' date within the period. Total: The actual total margin for the period. |
Actual | Values coming from the 'Timesheet detail,' 'Task,' 'Assignments' and 'Cost' records. Labor: The margin on the actual work performed by resources at the date of calculation. Inv & Exp: Sum of the Actual margin fields of all 'Cost' records that have an 'Actual date' date that is within or before the period. Total: The total actual margin. |
Remainin g | Values coming from the 'Assignments' and 'Cost' records. Labor: The total remaining available margin on all 'Assignments'. Inv & Exp: The margin on all 'Costs' which do not have an actual end date, or have an actual end date after the period. Total: The total remaining margin. |
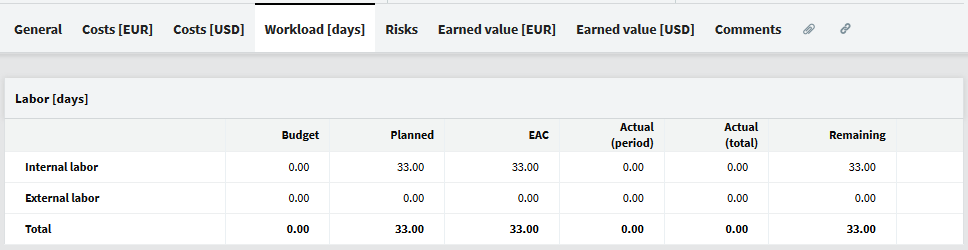
"Workload" tab
All calculations done for the 'Period' columns are either done according to the timesheet lines (if any exist on the project), or in a differential way (in comparison to the previous period).
The calculation from the timesheet lines is always correct, whatever the calculation date of the overview, as the timesheet lines are identified by period (provided that all Timesheets records were filled in by the time they were due).
The differential way implies a calculation of overviews each day to ensure that the information is up- to-date (this can be done through the corresponding scheduled agent, as set by the administrator).
Budget | Values come from the project 'Budget'. Internal Labor: The value is the sum of the workload budgeted for the internal project team members. External Labor: The value is the sum of the workload budgeted for the external project team members. Total: The total budgeted workload. |
Planned | Values come from the Assignment records. Internal Labor: The value is the sum of the planned workload for the internal project team members. External Labor: The value is the sum of the planned workload for the external project team members. Total: The total planned workload. |
EAC | Estimated At Completion. Values come from the 'Timesheet detail,' 'Assignments' and 'Cost' records. Internal Labor: Sum of the actual workload and remaining workload performed by the internal team members. External Labor: Sum of the actual workload and remaining workload assignments by external team members. Total: The total workload estimated at completion. |
Actual (Period) | Values come from the ‘Timesheet details,’ ‘Task,’ ‘Assignments’ and ‘Cost’ documents. Internal Labor: The workload performed by internal project team members during the period. See warning above for calculation. External Labor: The workload performed by external project team members during the period. See warning above for calculation. Total: The actual total costs for the period. |
Actual | Values come from the 'Timesheet detail', 'Task', 'Assignment' and 'Cost' records. Internal Labor: The actual workload performed by internal resources as of the calculation date. |
| External Labor: The actual workload performed by external resources as of the calculation date. Total: The total actual costs. |
| Values come from the 'Assignment' and 'Cost' records. |
Remain- ing | Internal Labor: The total remaining workload for all 'Assignments' assigned to internal resources. External Labor: The total remaining workload for all 'Assignments' assigned to external resources. |
| Total: The total remaining workload. |
"Risk" tab
The risks matrix displays the number of risks that exist for each corresponding cell. If none exists, then nothing is displayed. The size and color areas of the matrix are defined in the Risks labels setup document.
Please note that the 'General' section also contains important information relevant to the 'Risk (maximum severity)' field.
Clicking on the number in a cell will automatically open the corresponding risks. If there is only one, it is opened directly. If there is more than one risk, an intermediary window opens allowing users to select which risk to open.

"Earned Value" tab
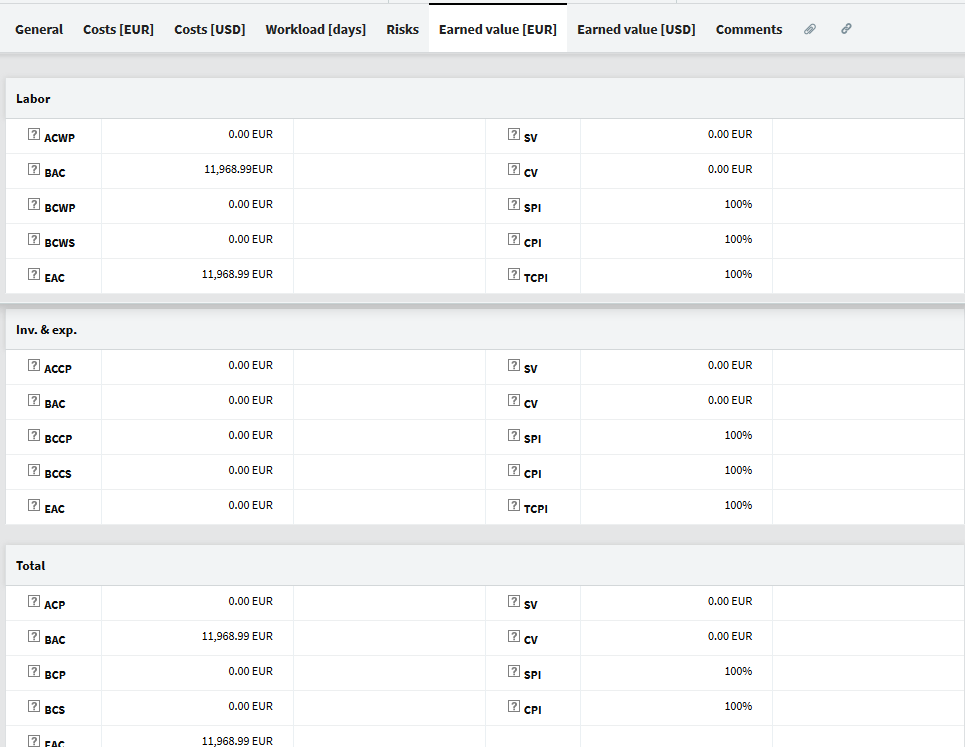
Labor | ACWP | Actual Cost of Work Performed. Measures the internal cost of the work already accomplished. |
BAC | Budget At Completion. Total planned costs for tasks. |
BCWP | Budgeted Cost of Work Performed. Measures the planned cost of the work already accomplished. The result is calculated by multiplying the planned cost of the task by the progress percentage of the task. |
BCWS | Budgeted Costs of Work Scheduled. Measures the internal cost of the work that should already be accomplished, if the task is performed with regularity during the entire planned duration. For example, on the fourth day of a task with a duration of 14 business days, the planned progress is 4/14 = 28.57%, which is multiplied by the planned cost of the task. |
EAC | Estimate At Completion. Actual Cost of Work Performed (ACWP) + estimated cost of remaining work. |
AV | Schedule Variance. BCWP - BCWS. When less work was performed than what was planned, the schedule variance becomes negative. |
CV | Cost Variance. |
|
| BCWP - ACWP. When the actual cost of accomplished work exceeds the budgeted cost, the cost variance becomes negative. |
SPI | Schedule Performance Index. BCWP / BCWS. This index is less than 1 when the actual progress is less than the planned progress. |
CPI | Cost Performance Index. BCWP / ACWP. This index measures the efficiency of past performance. For example, an index of 67% means that $0.67 of work has been accomplished for every dollar spent. |
TCPI | To Complete Performance Index. This index reveals the level of efficiency required to complete the remaining work within the budget. |
Inv & Exp |
ACCP | Actual Cost of Cost Performed. Sum of the 'Actual amount' fields for all 'Cost' documents, where the value of the 'Actual date' field is within or before the period. |
BAC | Budget At Completion. Total of the planned amount of all 'Cost' documents. |
BCCP | Budgeted Cost of Cost Performed. Total planned amount of all 'Cost' documents, where the value of the 'Actual date' date field is within or before the period. |
BCCS | Budgeted Costs of Costs Scheduled. Measures the planned cost of all expenses that should be paid, if the payment was done on the due date. |
EAC | Estimate At Completion. Actual Cost of Cost Performed (ACCP) + estimated cost of remaining expenses. |
SV | Schedule Variance. BCCP - BCCS. When the mount paid for expenses is less than what was planned, the schedule variance becomes negative. |
CV | Cost Variance. BCCP - ACCP. When the actual cost of paid expenses exceeds the budgeted cost, the cost variance becomes negative. |
SPI | Schedule Performance Index. BCCP / BCCS. This index is less than 100% when the actual expenses are less than planned. |
CPI | Cost Performance Index. BCCP / ACCP. This index is under 100% when the actual expenses are greater than planned. |
TCPI | To Complete Performance Index. This index reveals the level of efficiency required to pay the remaining expenses within the budget. |
Total |
ACP | Actual Cost Performed. Actual cost. Measures the actual cost of work already accomplished and expenses already paid. |
BAC | Budget At Completion. Global budget of the project. Total planned costs for tasks and investments & expenses. |
BCP |
Budgeted Cost of Cost Performed. |
|
| Total planned amount of all 'Cost' documents where the value of the 'Actual date' field is within or before the period. |
BCS | Budgeted Costs of Cost Scheduled. Measures the planned cost of work already accomplished and expenses already paid. |
EAC | Estimate At Completion. Global estimated cost. Actual Cost Performed (ACP) + estimated remaining cost of remaining work and expenses. |
SV | Schedule Variance. BCP - BCS. When the actual costs are behind schedule, the schedule variance becomes negative. |
CV | Cost Variance. BCP - ACP. When the actual cost exceeds the budgeted cost, the cost variance becomes negative. |
SPI | Schedule Performance Index. BCP / BCS. This index is less than 100% when the actual costs are less than planned. |
CPI | Cost Performance Index. BCP / ACP. This index is under 100% if the project's actual cost is greater than the planned cost. |