There are many views and reports available to track project progress. A number of these views are based on data found in the key Cerri Project document titles "Project Overview".
Project Overviews are setup to be generated automatically; however, they can also be generated or updated manually, either directly from the project description document or from the overviews view.
To learn how to generate a Project Overview from the Project Description document, see the chapter titled "Create Project – Project definition / Create Project Overview".
To manage project overviews from the view:
- Navigate to the [Projects] tab
- Click "Project Progress" in the contextual navigation menu and select "Overview by month".
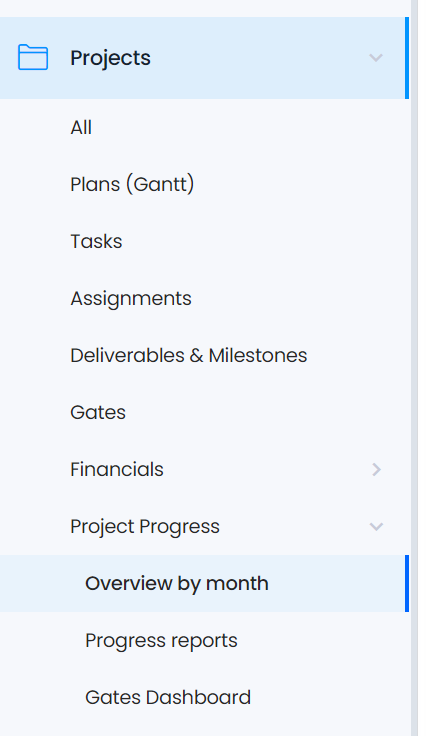
- All existing overviews will appear in the content window, categorized by project name.
- To update an existing report, locate the desired project and period, and open the report in edit mode.
- By clicking on one of the indicators in the view, the project overview opens.
- Many indicators and indexes are available for budget, workload, as well as earned value analysis.
Please refer to the help file to learn more about "Project overviews".
Many of the Project Tracking views are based on "Project overviews".
Overviews group data together on a monthly basis. The following documents are used to generate a project overview:
- Project description
- Budget details
- Tasks
- Assignments
- Timesheet detail
- Deliverables
- Cost
- Progress report
- Risk
- Issue report
Graphical displays of data offer a quick visual ovrview of project status. A series of charts is available for each view. Select a document in the view - the selected document's details will define the chart parameters.
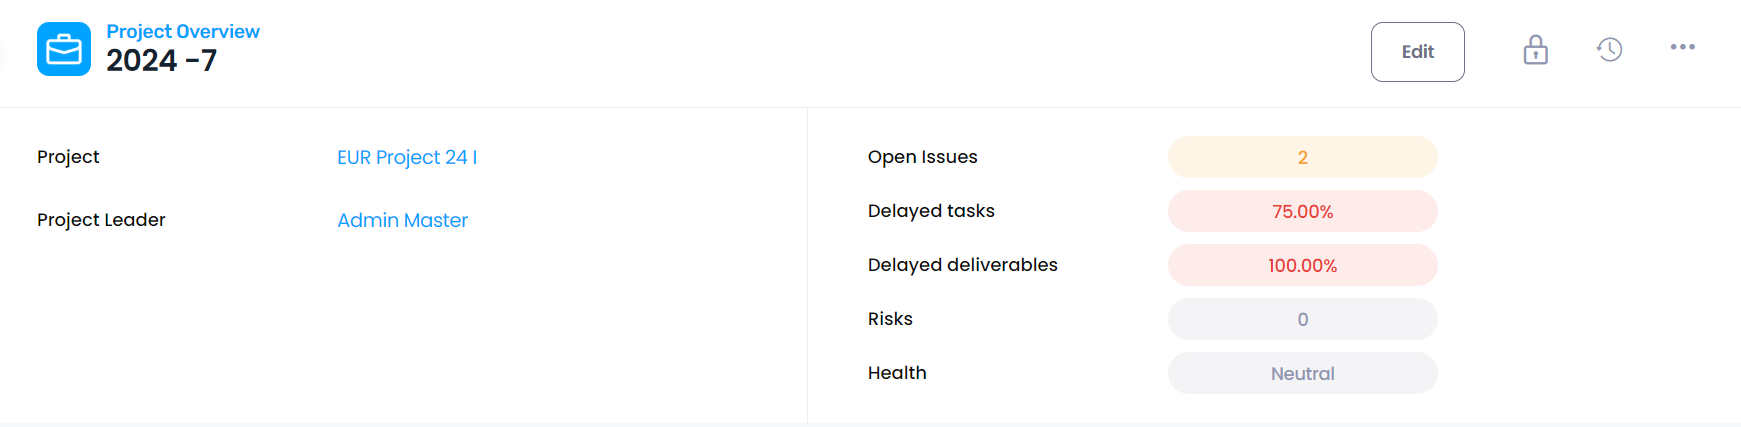
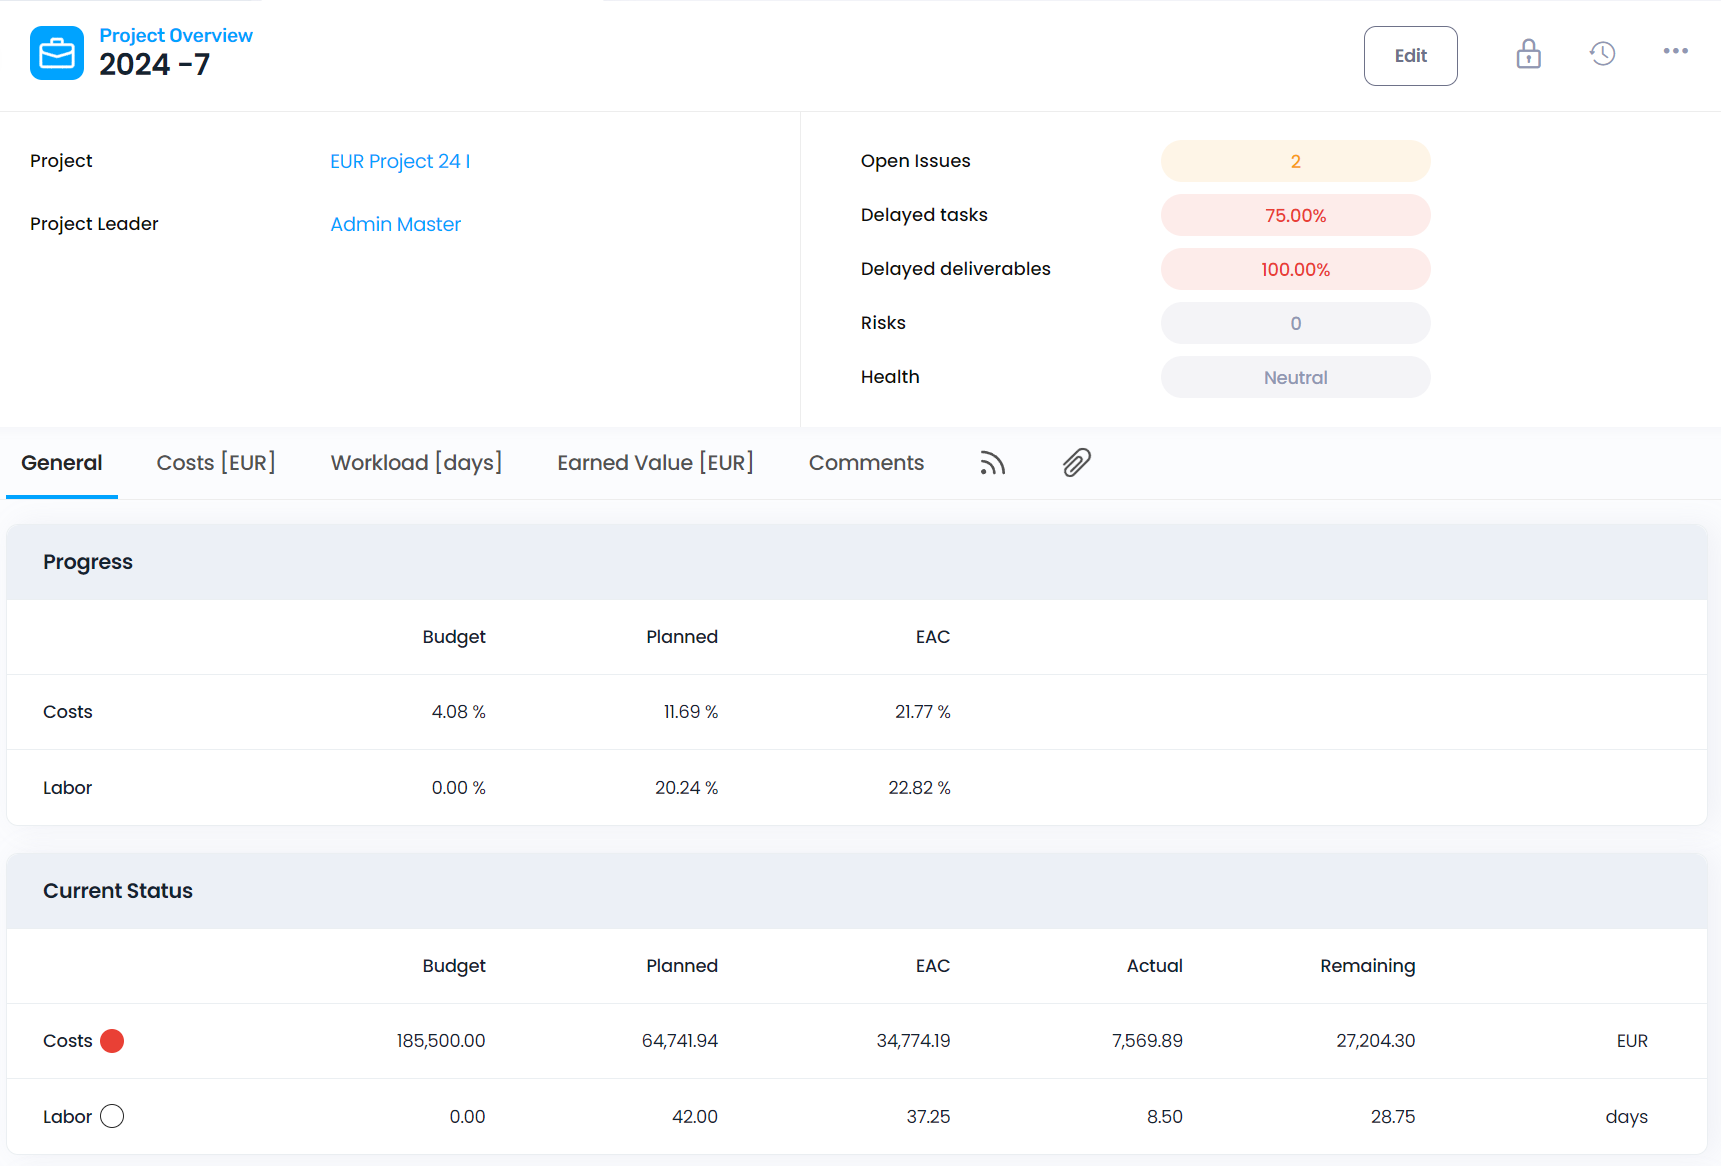
Project Name | The project title. In the example above, "EUR Project 24 I". |
Project leader | Name of the project leader. By default, this will be the creator of the project. |
Open Issues | Displays the number of Issue report documents that are still open.
- Green: Good - No open issues (all 'Issue reports' are marked as ‘completed’).
- Yellow: Medium - Up to three issues remain open.
- Red: Bad - More than three issues are still open.
Note: Default thresholds can be changed in the 'General' setup document.
|
Delayed tasks | Displays the percentage of delayed tasks in the project.
- Green: Good - Less than 10% delayed
- Yellow: Medium - Less than 20% delayed
- Red: Bad - More than 20% delayed
Thresholds are configurable in the 'General' setup document.
|
Delayed deliverables | Displays the percentage of delayed deliverables in the project.
- Green: Good - Less than 10%
- Yellow: Medium - Less than 20%
- Red: Bad - More than 20%
Thresholds are configurable in the 'General' setup document.
|
Risks | Displays the number of Risk documents associated with the project. If no risks are defined, the icon shows "0". Risk severity is indicated by icon color, based on risk matrix placement:
- White: No risk defined
- Green: All risks are in the green (low severity) zone
- Yellow: Risks are up to the orange (medium severity) zone
- Red: At least one risk is in the red (high severity) zone
|
Health
|
This value is manually defined value by the project leader in the project description document.
|
The "General" tab
Progress | Various indicators showing the project's progress: Costs - Budget %: Actual cost (from the Tasks and Costs records) divided by the budgeted costs. Costs - Planned %: Actual cost divided by the planned cost (from the 'Task' and 'Cost' documents). Costs - EAC %: Actual cost divided by the total cost estimated at completion. Labor - Budget %: Actual work (i.e. the time spent since the beginning of the project) divided by the budgeted workload. Labor - Planned %: Actual work divided by the planned workload (from the 'Task' documents). Workload - Economic %: 100% minus the remaining work divided by the planned work.
Labor- EAC %: Actual work divided by the total work estimated at completion. Example: If the budgeted workload is 15 days, the planned work is 16 days, the actual work is 10 days, and the remaining work is 8 days, the re-estimated workload becomes 18 days. Then:
Labor - Budget %: 66.6%
Labor - Planned %: 62.5%
Labor - EAC %: 55.5%
|
Current Status | Cost value are derived from the Budget section of the Project description, the 'Tasks' records, and the 'Cost' documents. The currency shown is the reference currency as defined in the General setup document.
- Green: Good. By default, actual costs are within the budget.
- Yellow: Medium. Actual costs are over budget, but not by more than 120%.
- Red: Bad. Actual costs are over budget, but by more than 120%.
Thresholds can be modified in the 'General' setup document. Labor values are derived from the 'Task' and 'Timesheet details' records. The unit is defined in the 'General' setup document (e.g. hours or days)
- Green: Good. Actual workload is within budget.
- Yellow: Medium. Actual workload is over budget, but not by more than 120%.
- Red: Bad. Actual workload is over budget, but by more than 120%.
Thresholds can be modified in the 'General' setup document.
|
Last project progress report | Displays the date of the most recent progress report. If no Progress report document exists for the current or previous periods, the value displayed is 0-0. The following indicators are related to ‘Unsolved problems' and 'Solved problems' fields in the last 'Progress report':
- Green: Good. No problems found. (Found problems field = No).
- Yellow: Medium. Problems found and resolved. (Found problems = Yes, and Solved problems = Yes)..
- Red: Bad. Problems found and not resolved (Found problems = Yes, and Solved problems = No).
|
|
Risks (Maximal severity) | Displays the highest severity among all defined project risks. If no Risk document exists, the icon appears with the number 0. Color coding:
- White: No risk defined.
- Green: All risks are in the green zone.
- Yellow: All risks are at most in the orange zone.
- Red: At least one risk is in the red zone.
|
|
Open issue reports | Displays the number of open Issue report documents.
- Green: Good. No issues remain open (all are marked completed).
- Yellow: Medium. Up to three issues remain open.
- Red: Bad. More than three open issues.
Thresholds can be modified in the 'General' setup document.
|
Delayed tasks | Displays the percentage of delayed tasks in the project.
- Green: Good. Less than 10%.
- Yellow: Medium. Less than 20% .
- Red: Bad. More than 20%.
Thresholds can be modified in the 'General' setup document.
|
Delayed deliverables | Displays the percentage of delayed deliverables in the project.
- Green: Good. Less than 10%.
- Yellow: Medium. Less than 20% .
- Red: Bad. More than 20%.
Thresholds can be modified in the 'General' setup document.
|
"Costs" tab
Note: Currency is the reference currency as defined in the General setup document.
All calculations for the 'Period' columns are either based on timesheet lines (if filled in by due time), or computed differentially relative to the previous period. Daily calculations via a scheduled agent ensure accuracy.
The calculation from the timesheet lines is always correct, whatever the calculation date of the overview, as the timesheet lines are identified by period (provided that all timesheets records were filled in by the time they were due).
The differential way implies a calculation of overviews each day to ensure that the information is up- to-date (this can be done through the corresponding scheduled agent, as set by the administrator).
|
| Values coming from the 'Budget' section of the Project description document. |
Expenses | Budget |
- Labor: Budgeted labor costs.
- Inv & Exp: Budgeted non-labor related costs (Investments and Expenses).
- Total: Combined total.
|
|
| |
Planned | Values coming from the Task and Cost records
- Labor: Planned labor costs
- Inv & Exp: Planned non-labor costs (Investments and Expenses).
- Total: Combined total.
|
EAC | Estimated At Completion. Values coming from the 'Timesheet detail,' 'Task,' 'Assignments' and 'Cost' records.
- Labor: Actual (total) + remaining labor costs.
- Inv & Exp: Actual (total) + remaining non-labor costs.
Total: Combined total.
|
Actual (Period) | Values coming from the ‘Timesheet detail,’ ‘Task,’ ‘Assignments’ and ‘Cost’ documents.
- Labor: Labor cost during the period.
Inv & Exp: Costs with actual date in period.
- Total: Combined total.
|
Actual | Values coming from the 'Timesheet detail', 'Task', 'Assignments' and 'Cost' records.
- Labor: Cumulative labor costs.
Inv & Exp: Costs with actual date in or before period.- Total: Combined total.
|
Remaining | Values coming from the 'Assignments' and 'Cost' records.
- Labor: Remaining cost of 'Assignments.'
- Inv & Exp: Costs without end date or after period.
- Total: Combined total.
|
Billing |
Budget | Values coming from the project 'Budget.'
- Labor: Budgeted billable amounts for labor.
Inv & Exp: Budgeted billable non-labor related costs.
- Total: Combined total.
|
Planned | Values coming from the Tasks and Costs records
- Labor: Planned billable costs for labor on tasks.
- Inv & Exp: Planned billable non-labor related costs.
- Total: Combined total..
|
Actual (Period)
|
Values coming from the Timesheet detail, Task, Assignments and Cost records.
- Labor: Billable labor performed during the period. See warning above for calculation.
Inv & Exp: 'Actual billing amounts with actual date in period.
Total: Combined total.
|
|
|
|
Actual | Values coming from the 'Timesheet detail', 'Task', 'Assignments' and 'Cost' records.
- Labor: Cumulative labor costs.
- Inv & Exp: Costs with actual date in or before period.
- Total: Combined total.
|
Remaining | Values coming from the 'Assignments' and 'Cost' records.
- Labor: Remaining cost of 'Assignments.'
- Inv & Exp: Costs without end date or after period.
- Total: Combined total.
|
Margins |
Budget | Values coming from the 'Budget' of the Project
- Labor: Budgeted margin for labor.
- Inv & Exp: Budgeted margin for non-labor related costs.
- Total: Combined total.
|
Planned | Values coming from the Tasks and Costs records
- Labor: Planned margin for labor.
- Inv & Exp: Planned margin for non-labor related costs.
- Total: Combined total.
|
Actual (Period) | Values coming from the Timesheet detail, Task, Assignments and Cost records.
- Labor: Planned margin for labor during the period. See warning above for calculation.
- Inv & Exp: Planned margin for costs with Actual date in period.
- Total: Combined total.
|
|
Actual | Values coming from the 'Timesheet detail,' 'Task,' 'Assignments' and 'Cost' records.
- Labor: Cumulative margin on labor costs.
- Inv & Exp: Margin of costswith actual date in or before period.
- Total: Combined total.
|
|
|
|
Remainin g
| Values coming from the 'Assignments' and 'Cost' records.
- Labor: Remaining margin on all 'Assignments'.
- Inv & Exp: Margin on costs without an end date or after period.
- Total: Combined total.
|
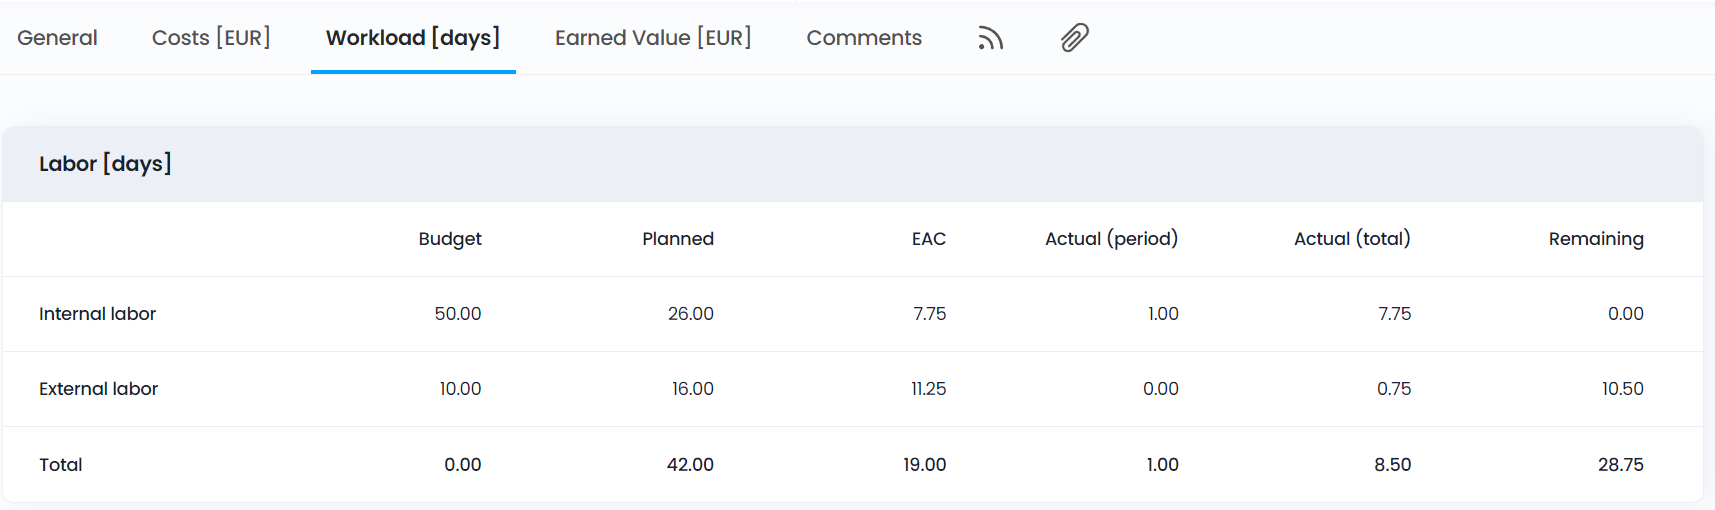
"Workload" tab
All the calculations for the 'Period' columns are either done according to the timesheet lines (if any exist on the project), or in a differential way (in comparison to the previous period).
The calculation from the timesheet lines is always correct, whatever the calculation date of the overview, as the timesheet lines are identified by period (provided that all Timesheets records were filled in by the time they were due).
The differential way implies a calculation of overviews each day to ensure that the information is up- to-date (this can be done through the corresponding scheduled agent, as set by the administrator).
Budget | Values come from the project 'Budget'.
- Internal Labor: Workload budgeted for internal team members.
External Labor: Workload budgeted for external team members.
Total: Combined total.
|
Planned | Values come from the Assignment records.
- Internal Labor: Planned workload for internal team members.
- External Labor: Planned workload for external team members.
Total: Combined total.
|
EAC | Estimated At Completion. Values come from the 'Timesheet detail,' 'Assignments' and 'Cost' records.
- Internal Labor: Actual + remaining workload for internal team members.
- External Labor: Actual + remaining workload for external team members.
Total: Combined total.
|
Actual (Period) | Values come from the ‘Timesheet details,’ ‘Task,’ ‘Assignments’ and ‘Cost’ documents.
- Internal Labor: Workload performed by internal team members during the period. See warning above for calculation.
- External Labor: Workload performed by external team members during the period. See warning above for calculation.
Total: Combined total.
|
Actual | Values come from the 'Timesheet detail', 'Task', 'Assignment' and 'Cost' records.
- Internal Labor: Actual workload performed by internal resources.
- External Labor: Actual workload performed by external resources.
- Total: Combined total.
|
| Values come from the 'Assignment' and 'Cost' records. |
Remaining |
- Internal Labor: Remaining workload for all 'Assignments' to internal resources.
- External Labor: Remaining workload for all 'Assignments' to external resources.
|
| - Total: Combined total.
|
"Risk" tab
The risks matrix displays the number of risks that exist for each corresponding cell. If none exists, then nothing is displayed. The size and color areas of the matrix are defined in the Risks labels setup document.
Please note that the 'General' section also contains important information relevant to the 'Risk (maximum severity)' field.
Clicking on the number in a cell will automatically open the corresponding risks. If there is only one, it is opened directly. If there is more than one risk, an intermediary window opens allowing users to select which risk to open

"Earned Value" tab
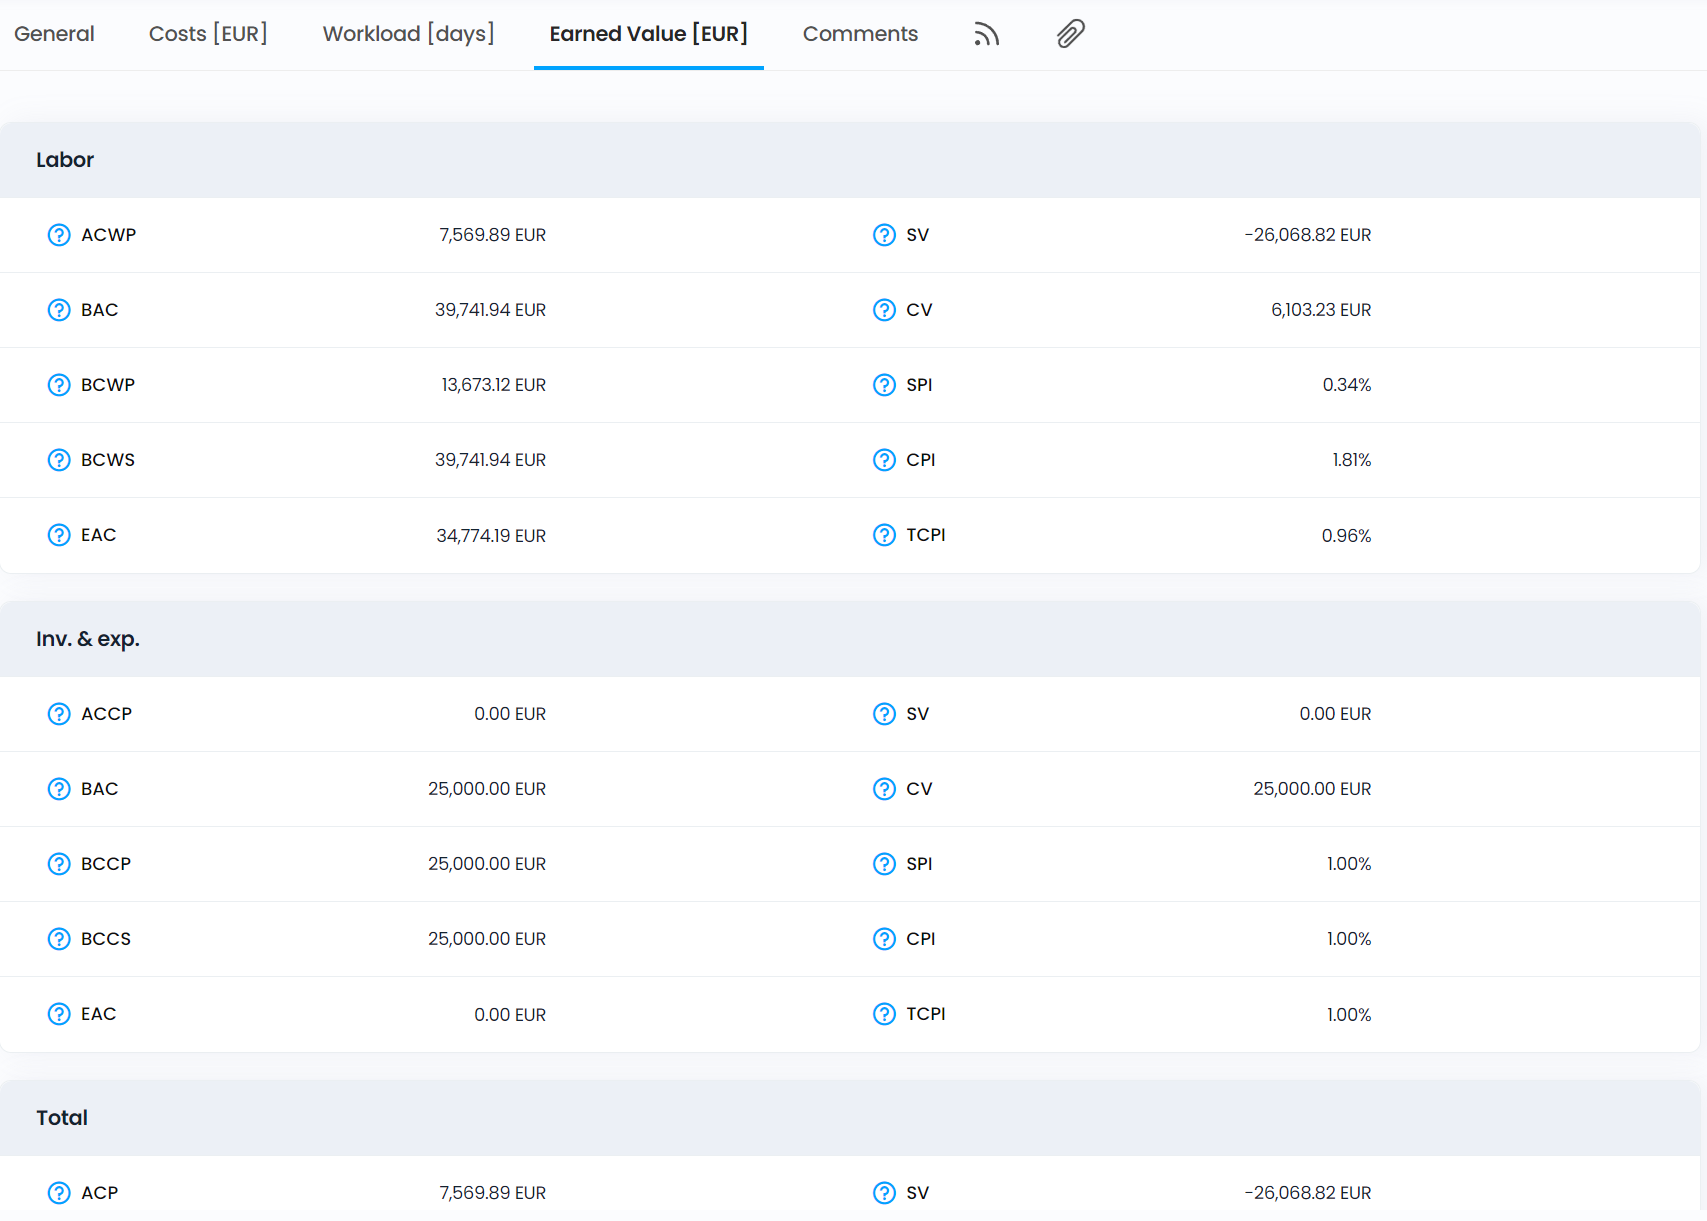
Labor | ACWP | Actual Cost of Work Performed. Internal cost of completed work. |
BAC | Budget At Completion. Total planned task costs. |
BCWP | Budgeted Cost of Work Performed. Planned cost of completed work ( = planned task cost x % of task progress).
|
BCWS | Budgeted Costs of Work Scheduled. Planned cost of work that should have been completed, if task was worked on regularily during the planned duration.
Example: On the fourth day of a task with a duration of 14 business days, the planned progress is 4/14 = 28.57%. This is then multiplied by the planned cost of the task.
|
EAC | Estimate At Completion. Actual Cost of Work Performed (ACWP) + estimated remaining cost. |
AV | Schedule Variance. BCWP - BCWS. Negative = behind schedule. |
CV | Cost Variance. BCWP - ACWP. Negative = over budget. |
|
|
|
SPI | Schedule Performance Index. BCWP / BCWS. Below 1 = behind schedule |
CPI | Cost Performance Index. BCWP / ACWP. Efficiency of budget use.
Example: an index of 67% means that $0.67 of work has been accomplished for every dollar spent.
|
TCPI | To Complete Performance Index. Efficiency needed to complete within budget. |
Inv & Exp |
ACCP | Actual Cost of Cost Performed. Sum of actual paid costs where the actual date is within or before the period. |
BAC | Budget At Completion. Total planned amount of all 'Cost' documents. |
BCCP | Budgeted Cost of Cost Performed. Total planned cost of paid expenses where the 'Actual date' is within or before the period.
|
BCCS | Budgeted Costs of Costs Scheduled. Planned cost of all expenses if paid on due date. |
EAC | Estimate At Completion. Actual Cost of Cost Performed (ACCP) + estimated cost of remaining expenses. |
SV | Schedule Variance. BCCP - BCCS. Negative = behind schedule. |
CV | Cost Variance. BCCP - ACCP. Negative = over budget. |
SPI | Schedule Performance Index. BCCP / BCCS. < 100% when actual expenses are less than planned. |
CPI | Cost Performance Index. BCCP / ACCP. <100% when actual expenses are greater than planned. |
TCPI | To Complete Performance Index. Level of efficiency needed to pay the remaining expenses within the budget. |
Total |
ACP | Actual Cost Performed. Sum of all actual cost of work completed and expenses paid. |
BAC | Budget At Completion. Global budget of the project. Total planned costs for tasks and investments & expenses. |
BCP |
Budgeted Cost of Cost Performed.
Total planned 'Cost' documents where the value of the 'Actual date' field is within or before the period.
|
|
|
|
BCS | Budgeted Costs of Cost Scheduled. Planned cost of work completed and expenses already paid. |
EAC | Estimate At Completion. Global estimated cost. Actual Cost Performed (ACP) + estimated remaining cost of remaining work and expenses. |
SV | Schedule Variance. BCP - BCS. Negative = behind schedule. |
CV | Cost Variance. BCP - ACP. Negative = over budget |
SPI | Schedule Performance Index. BCP / BCS. > 100% when actual costs are less than planned. |
CPI | Cost Performance Index. BCP / ACP. > 100% when actual cost is greater than planned. |