Genius Planner, Gantt Chart Overview (v8.xx)
Geniusproject offers a suite of robust project management tools that allow users to plan quick, small projects not requiring complex charts and features as well as more detailed projects and plans using the Genius Planner Gantt Charting tool. This section will focus on projects that are planned using a Gantt charting tool.
A Gantt chart is the ideal tool for successful visual communication of the project plan. It is a graphical representation of activity (task) development within a defined time frame as well as milestones (deliverables). It is used for the definition of tasks, for their duration and dependencies, and for communication between the different responsible parties.
The Gantt chart is used to build a plan according to the following theoretical process: Identify the products of the project (deliverables).
Identify the means to realize the deliverables (tasks). Manage the links between the tasks and the deliverables. Manage the delays.
Manage the resources (assignments).
In Geniusproject, the plan is the entry point for the creation of deliverables, tasks, management of delays and costs. The plan also allows for comparisons of actuals versus forecasts, to visualize eventual slippages and to react accordingly on the plan. The real dates (actual start date, remaining, etc.) are not captured in the plan, but in "task" and "deliverable" forms or in "timesheets" which are available to each of the project participants. The dates reported by the project members are then updated in the project plan.
Each time a new project is created, its plan is automatically created with it. To open your project’s Gantt chart:
Navigate to the [Projects] tab on the module bar. Open the "Tasks & plans" -> "Plans-Gantt" view.

Find your project in the list and click on the next to its name
Click on "plan" to open the Gantt in read mode, or right click on "plan" and select "Edit" to launch the Gantt in edit mode

You will enter the "Plan" Document.
Note: Entering the Plan Document directly from your Project, click on the link called "Display the gantt".

The Genius Planner Gantt chart is embedded in this form where additional planning options can be set.
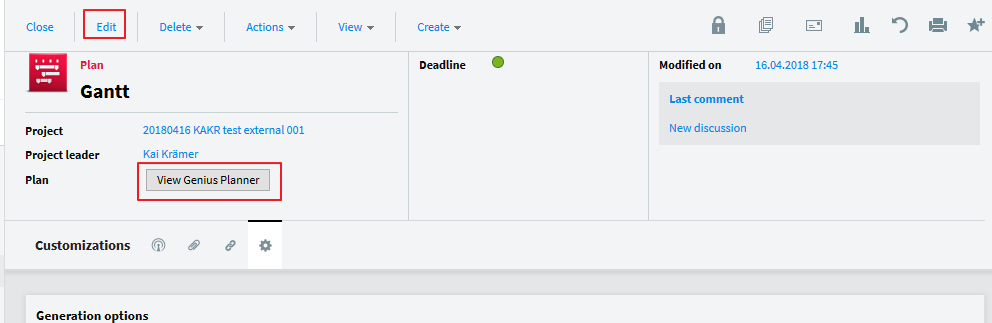
Click on the button to open the Gantt. You can change to edit by the menu here, too.

Note: To learn more about the options see the section, "The Plan form’s planning options".
You will be asked to reload the Plan data from Server or to use the data from Browser cache.

The Planer Toolbar depends on view or edit mode:
A smaller Toolbar is shown in view mode, reduced on necessary functions.
The bigger Toolbar offers all function to create and edit the Plan.

Genius Planner is divided into multiple sections:
Window title containing the project name Tool bar
Activities Table Gantt Chart Resource Table Schedule diagram

You can reduce or expand the sections by dragging the middle bar.

Related Articles
Cerri Planner, Gantt Chart Overview (v10.xx)
Cerri Project offers a suite of robust project management tools tailored to both quick, simple projects without complex charts and features, as well as detailed projects and plans using the Cerri Planner Gantt Chart tool. This section focuses on ...The Dynamic Gantt Chart (v8.xx)
The Gantt Chart is used to graphically display the project’s timeline including its phases, tasks, milestones and constraints. The dynamic Gantt Chart can be used to scroll forward and back along the project timeline by clicking and holding directly ...Quick Gantt and Global Gantt (v8.xx)
Genius Planner offers the ability to provide a multi-project gantt chart that will allow for global visibility on the progress & timelines of multiple projects at once. The Genius Project Planner and Gantt Tool is compatible with all major browsers ...Genius Chart (v8.xx)
Genius Project is a project management and PPM software that offers 100% configurable project dashboards. The project dashboards can contain only the views or graphics you want, or a combination of both. Once defined, these dashboards can be made ...The Dynamic Gantt Chart (v10.xx)
The Gantt Chart visually represents a project’s timeline, including phases, tasks, milestones, and constraints. The dynamic Gantt Chart can be used to scroll through the project timeline by clicking and holding anywhere on the chart (not directly on ...