Check Project Status and Progress (v8.xx)
A project Manager wants to know the status of his(her) project(s). Project managers want to have a clear view of project status, and deadlines? Are they on time? Budget? Any risk or quality problems? What is the project’s trend?
Geniusproject provides a long list of reports helping project managers track projects.
The main project list gives a clear snapshot of a project’s status, including Project Health, deadline, Priority, Progress, start and end dates.
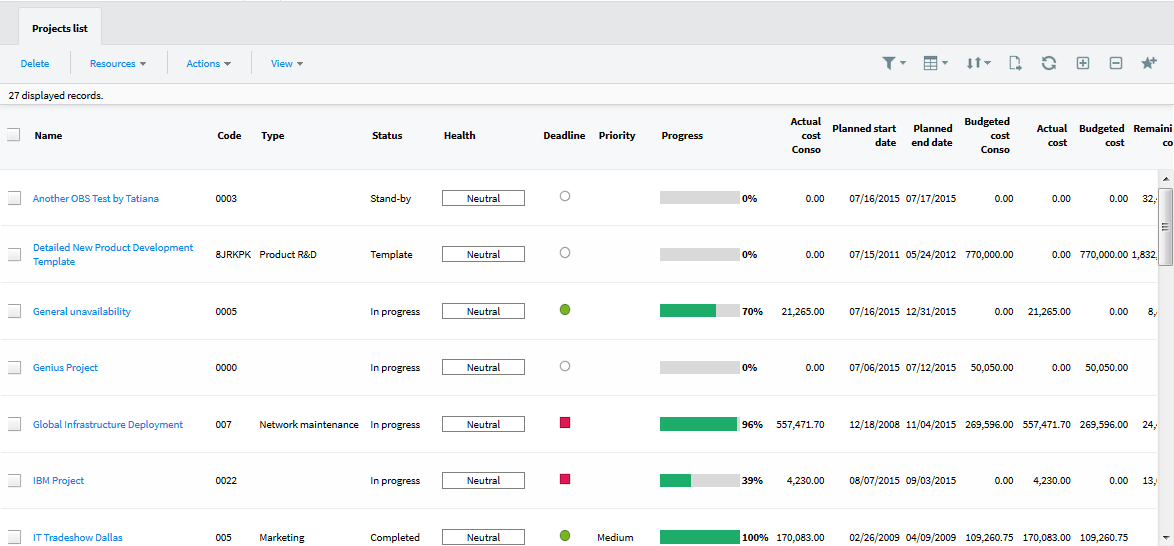
To get more details about project status, go to the contextual navigation "Progress Status" or "Dashboards and charts," in the "Project" module.
Project progress status

The project’s percentage of progress is been calculated by all Tasks. There is no progress, if there is no physical / actual effort.
Note: If you do not have the same settings in project options and all tasks, the project progress won't run.
Project progress per Phase
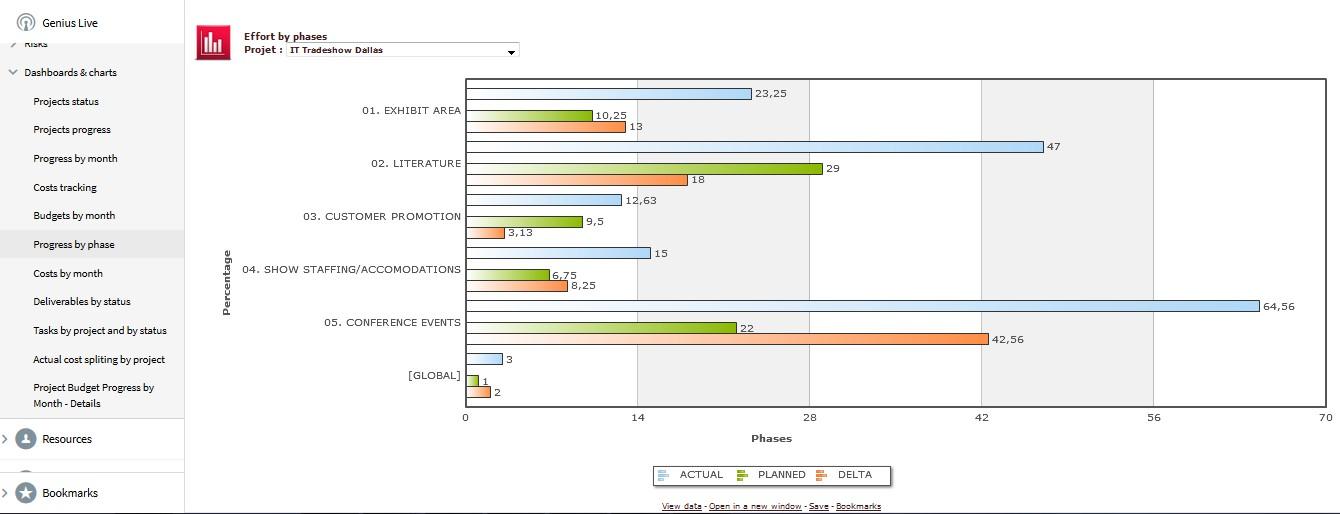
This chart shows, actual, remaining, planned effort for each project phase.
Calculation for Phase progress:
All Tasks must have a Workload.
You must have saved the initial baseline.
The Project and all tasks must have the same options.
The percentage of progress for labor, based on time spent on tasks belonging to the phase.
Project Monthly Overview, a clear view project status and trend
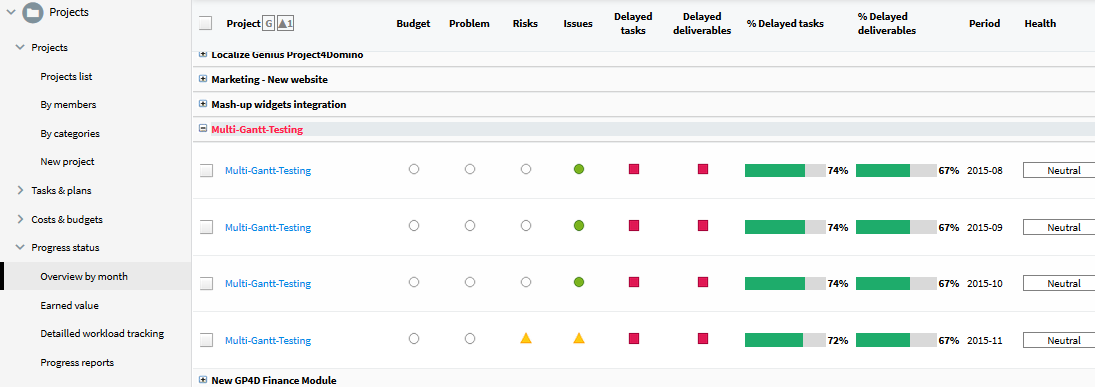
The view "Project status/Overview by month" based on project overview records, shows project status and progress visual indicators month by month, alowing project managers to see the evolution of the different indicators over periods of time.
Note: See the "Project Overview" record description to understand the colour codes.
Monthly progress reports
Despite Geniusproject s automatically various indicators, a good project status report requires a project manager’s input.
The 'Progress report' is the document that allows the project leader to give a report on the progress of a project thus far. Beyond the automatic indicators found in the Project overview, these documents allow the Project leader to submit a personal assessment. This is also where he/she is going to give an account of encountered problems, as well as found solutions, if any.
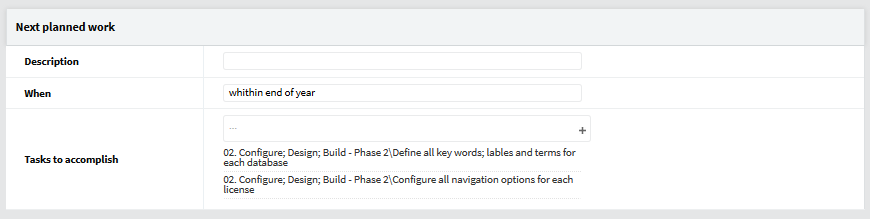
The Progress Report header

The General tab
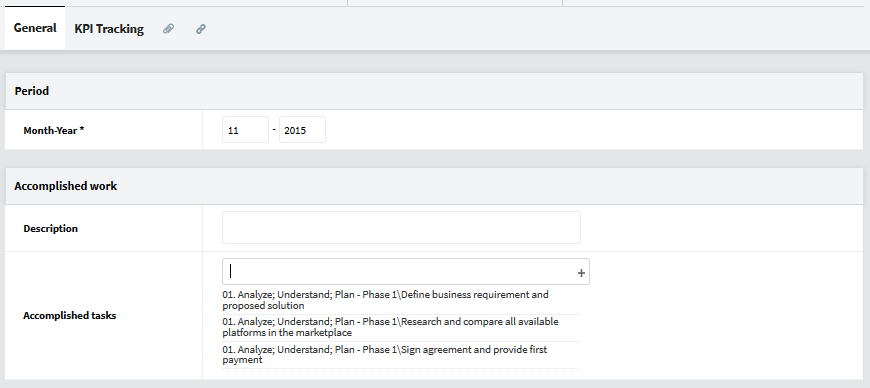

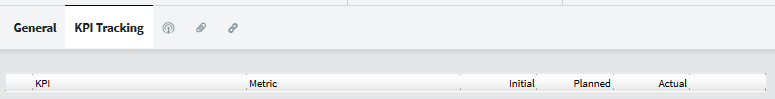
The KPI tab
This section only appears if the option 'By month' is checked in the field, 'Metric capture mode' of the General setup of the 'Portfolio' database. See KPI module chapter.
The Monthly progress report view
The view "Progress reports" shows a clear view of the project manager’s problems reports on a monthly basis.

Earned Value Tracking
Earned value management is a project management technique for measuring project performance and progress. It has the ability to combine measurements of: Scope, Schedule and Costs.
In a single integrated system, Earned Value Management is able to provide accurate forecasts of project performance problems, which is an important contribution for project management.
Earned Value Management (EVM) helps project managers to measure project performance. It is a systematic project management process used to find variances in projects based on the comparison of worked performed and work planned. EVM is used on the cost and schedule control and can be very useful in project forecasting. The project baseline is an essential component of EVM and serves as a reference point for all EVM related activities. EVM provides quantitative data for project decision making.
EVM Measures
EVM consists of the following primary and derived data elements. Each data point value is based on the time or date an EVM measure is performed on the project.
Primary Data Points:
Budget At Completion (BAC) - Total cost of the project.
Budgeted Cost for Work Scheduled (BCWS) / Planned Value (PV) - The amount expressed in Money (or hours) of work to be performed as per the schedule plan.
PV = BAC * % of planned work.
Budgeted Cost for Work Performed (BCWP) / Earned Value (EV) - The amount expressed in Money (or hours) on the actual worked performed.
EV = BAC * % of Actual work.
Actual Cost of Work Performed (ACWP) / Actual Cost (AC) - The sum of all costs (in Pounds) actually accrued for a task to date.
For example, say we should have completed $800 of work by today. However, we only completed
$600 worth of work. The BCWP is $600. The BCWS is $800. And if we actually paid $700 then (ACWP) = $700
Derived Data Points - Cost Forecasting:
Estimate At Completion (EAC) - The expected TOTAL cost required to finish completed work.
EAC = BAC / CPI = AC + ETC = AC + ((BAC - EV) / CPI) (typical case) = AC + (BAC -
EV) (atypical case)
Here a typical means it is assumed that similar variances will not occur in the future.
Estimate to complete (ETC) -The expected cost required to finish all the REMAINING work.
ETC = EAC - AC = (BAC / CPI) - (EV/CPI) = (BAC - EV) / CPI
Derived Data Points - Variances:
Cost Variances (CV) - How much under or over budget.
CV = EV-AC - NEGATIVE is over budget, POSITIVE is under budget.
Schedule Variances (SV) - How much ahead or behind schedule.
SV = EV-PV - NEGATIVE is behind schedule, POSITIVE is ahead of schedule.
Variance At Completion (VAC) - Variance of TOTAL cost of the work and expected cost. VAC = BAC – EAC.
Performance Indices:
Cost Performance Index.
CPI = EV / AC - Over (< 1) or under (> 1) budget.
Schedule Performance Index.
SPI = EV / PV - Ahead (> 1) or behind (< 1) schedule.
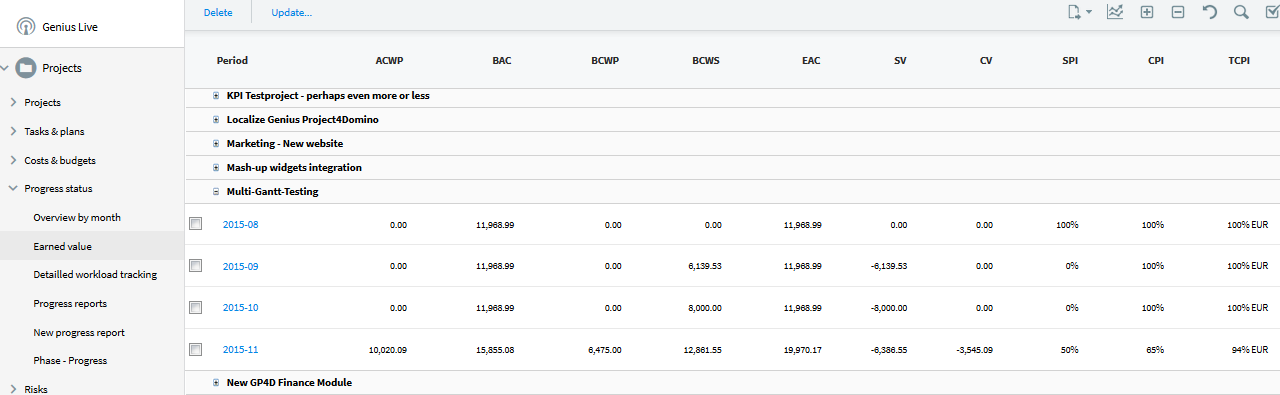
The view "Progress status/Earned value" shows earned value indicators by month. This report is based on project’s overview records.
Related Articles
Check Project Status and Progress (v8.xx)
A project manager wants to know the status of their project(s). Project managers seek a clear view of project status and deadlines Are they on time? On budget? Are there any risks or quality issues? What is the project’s trend? Cerri Project provides ...Check Deliverables Status / Milestone Follow-Up (v8.xx)
Deliverables are one of the project leader’s best tools to check the project’s progress. They summarize the result of several tasks and give the project leader an immediate view of the project's status. Deliverables can be created directly in the ...Check Deliverables Status / Milestone Follow-Up (v10.xx)
Deliverables are one of the project leader’s best tools to check the project’s progress. They summarize the results of several tasks and give the project leader an immediate view of the project's status. Deliverables can be created directly in the ...Check task and Assignment Progress (Workload and Deadlines) (v8.xx)
A project leader will need to track the actual work done on his/her project at any given time. The planned workload can be compared to the actual work performed on tasks/assignments. Most of the tasks and assignments tracking reports are part of the ...Check Task and Assignment Progress (Workload and Deadlines) (v10.xx)
A project leader needs to monitor actual work done on projects in real-time. Comparisons can be made between the planned workload and actual work performed on tasks and assignments. The [Tasks & Plan] section of the "Projects" module contains most of ...